A Smarter Approach to Green Chemistry
To bring these principles into practice, we’ve developed a powerful assessment tool that enables rapid evaluation of greener process options. This approach provides early visibility into environmental impact and potential risks, helping teams make informed decisions sooner and avoid costly adjustments later.
Rather than using several tools from various guiding agencies, our green chemistry (GrC) assessment allows rapid evaluation for improvements at early stages of development. The tool’s primary advantage is the integration and distillation of multiple green chemistry metrics, metric calculations, qualitative comparisons, and visualization outputs into a single workflow, allowing scientists to evaluate process options with consistency and minimal time input.
The GrC assessment combines calculation forms, a general assessment form, a scheme graphics toolbox, and infographics into a single workbook. The analyst completes the assessment form to evaluate routes and visualize areas of greener attributes vs. improvement opportunities indicated by green-amber-red color code. For example, it shows the use of preferred solvents, catalytic processes, hazardous materials, process mass intensity (PMI), and relative process greenness (RPG benchmarking against industry standards). Infographics combining metrics for efficiency, health & safety, and innovation are then autogenerated to highlight details for a single route (Figure 1) and comparison of two routes (Figure 2). Additionally, the graphic for a single route assessment provides a breakdown of the PMI by step and material class which helps identify primary waste contributors and highlights areas of high efficiency. The tool facilitates rapid organization and visualization of decision-making information.
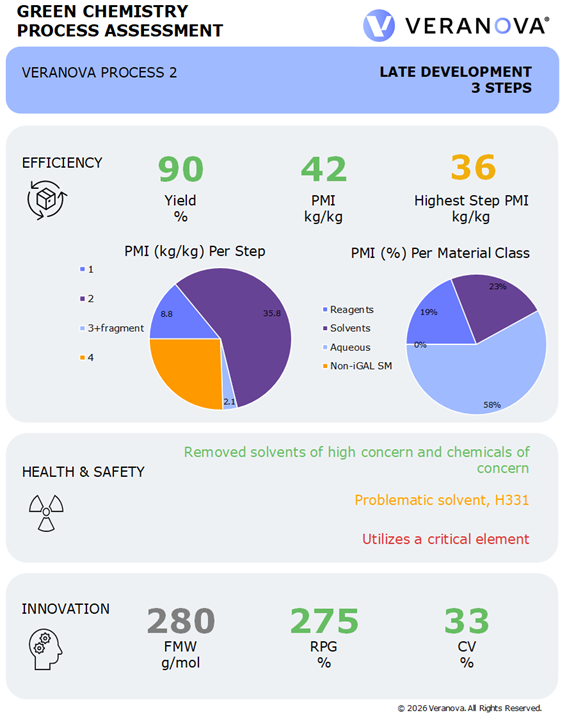
Figure 1: Example green chemistry process ainfographic for a single route. Metrics include yield, process mass intensity (PMI), relative process greenness (RPG), and convergence (CV), as well as statements summarizing qualitative health and safety data. Charts are included for the PMI breakdown by material and step.
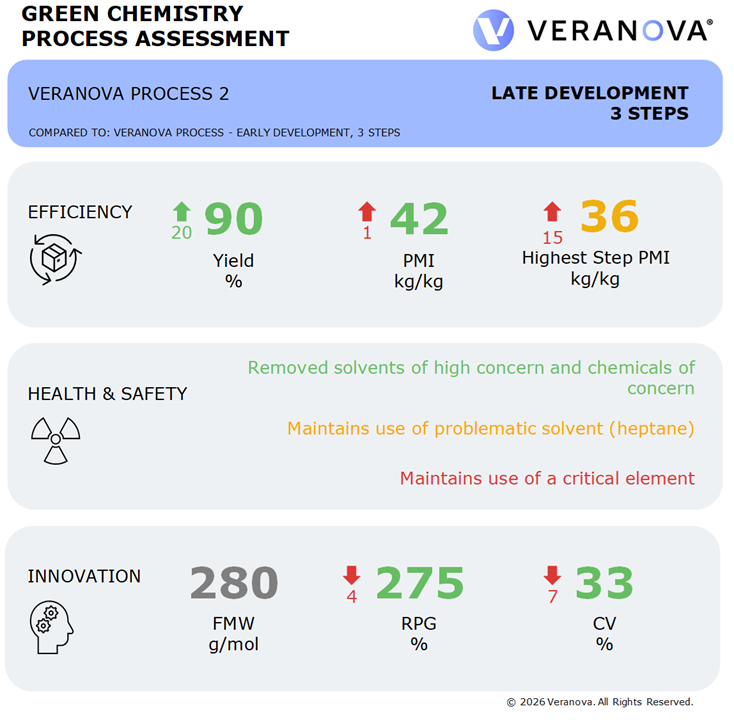
Figure 2: Example green chemistry process assessment infographic for a comparison of processes. Metrics include single route and route comparison values for yield, PMI, RPG, and CV, as well as comparison statements summarizing qualitative health and safety data.
The GrC assessments strengthen process development decisions that lead to measurable gains in scale‑up efficiency, operator safety, and environmental impact. The value of the tool is illustrated here through application to case studies that highlight the incorporation of green chemistry principles in both early-phase development and continuous improvement programs for APIs. In support of an early-phase highly potent API program, this approach demonstrated a reduction in PMI of nearly 1200 kg/kg product. The same project also realized removal of two hazardous solvents. In a second example, our team established efficiency increases for a commercial amphetamine derivative resulting in a PMI reduction of 4 kg/kg purification resin and 10 kg/kg in solvent. Based on 2025 production volumes, the calculated waste reduction could reach 9,000 kg of polymer media and 21,000 kg of solvent if the redeveloped process is fully utilized.
In practice, we are actively implementing this approach internally across all sites and engaging in customer conversations around GrC impacts. Our continued commitment to greener processes includes:
- Applying the GrC Process Assessment to new development projects for customer processes and commercial process improvements.
- Building our internal database of GrC metrics for benchmarking.
- Applying the Analytical GREEnness Metric Approach to analytical chromatography method development projects.
- Generating internal and external awareness of GrC evaluations with customers and team members.
- Strengthening industry leadership, technical exchange, and future opportunity through our membership with the American Chemical Society Green Chemistry Institute Pharmaceutical Roundtable (ACS GCIPR).
- Evolving with and helping shape the current recommendations for effectiveness, standardization, and expansion of the assessment scope like next generation benchmarking and additional pharmaceutical lifecycle analysis.
Driving Better Outcomes
By combining rigorous metrics with intuitive visualization, Veranova’s green chemistry assessment tool empowers teams to make smarter, faster, and more sustainable process decisions, helping to deliver measurable improvements in safety, efficiency, and environmental performance.